Service User Inclusion in Social Work Education, a Factor Analysis-Juniper Publishers
Annals of Social Sciences & Management Studies-Juniper Publishers
Social Work Education in the United States
Social work curricula across the United States lacks service user inclusion in the education of social workers, despite the trademark of the profession being service user oriented. Social work education in the United States requires a four-year undergraduate degree, or a two-year graduate degree, in social work. Both undergraduate and graduate social work degrees require students to complete internship hours working with individuals, families, groups, communities and/or organizations, with the goal of enabling and encouraging the application of social work-related knowledge, skills and values covered during classroom instruction (theory) within real-life settings (practice). For many students, the internship serves as the first encounter with service users of social service organizations, meaning they may have little-to-no understanding of service user experiences, or the skills needed to work collaboratively with service users, prior to this point in their academic careers.
Social workers are tasked with assessing service users of social service organizations for eligibility and need for services, thereafter, working collaboratively with service users to meet these assessed need(s). Social workers in the United States are expected to adhere to the National Association of Social Workers (NASW) Code of Ethics, which emphasizes respect for service users, service user self-determination and preservation of the dignity and worth of every person [1]. International professionals in the field of academia, as well as social workers and service users, have argued in favor of service users being included in the education of social work students to prepare and equip them with the knowledge, skills and values necessary to provide social work services to service users while on their internship and after graduation [2,3].
Service User Inclusion in Social Work Education
Between 2003 and 2004, the inclusion of service users receiving health and social work services became mandatory in social work education in the United Kingdom (UK). Service user inclusion was viewed as important and necessary for the “new generation of social workers to gain a thorough grounding in clients’ experiences and expectations from the very start of their training and careers” [3]. Universities and social service organizations varied in the extent to which service users were included and some academics began to publish case studies and evaluations of service user inclusion [4].
Branfield [5] explored service user perceptions of their own inclusion in UK-based social work education, including barriers to, and components of, good practice. Service users reported that in order to employ and promote quality social workers, service users should take part in their education, which should entail inclusion in the selection of students into the program (admission), training and writing coursework (curriculum) and evaluating student progress (assessment). Service users reported potential barriers to their inclusion, such as access to the university, inadequate training and negative attitudes from faculty and students toward their inclusion. Alternatively, good practice was identified as accessibility to the university, identifying and providing training to service users as well as faculty and students being open and receptive to service user knowledge and experience. Branfield [5] and the service users concluded that best practice approaches to service user inclusion remains relatively unknown.
Universities across Europe and the rest of the world have begun considering service user inclusion in social work education. Robinson & Webber [4] conducted a comprehensive review of the current literature on the models and effectiveness of service user inclusion in social work education. The research reviewed was primarily conducted in the UK (where, as aforementioned, service user inclusion is mandatory) and included only four studies -- two from Croatia, one from Israel and one from the US. The US-based study was an evaluation of a small-scale project consisting of a one-day (6 hour) activity bringing social service users into a facilitated dialogue with social work students with the aim of changing student attitudes towards persons with mental illness [6]. No further studies of service user inclusion in social work education in the US have been found. Therefore, there is currently limited knowledge on the extent to which service users are included in social work education in the US and the potential benefits and drawbacks to inclusion for students, service users and the overall social work profession.
Rationale for the Study
Self-determination, empowerment and partnership with service users are all central values to social work practice [1]. Students, both undergraduate and graduate, are taught to establish collaborative relationships with service users during their coursework and internships. In fact, the very paradigm of social work is to act “with” and not “for” service users. Although service user input is currently incorporated in social work education in indirect ways (e.g. literature with first-person service user accounts and service user feedback on intervention literature), social work educators need to evaluate whether or not the aforementioned social work values are genuinely incorporated into curriculum, or if the inclusion is more tokenistic and superficial [7]. Schools of social work in the United States have emphasized incorporating content related to racial and ethnic minority groups taught by faculty members belonging to those groups [8] with service users occasionally being included as guest speakers or co-trainers in the classroom [9]. However, it cannot be assumed that the appropriate faculty will have the ability and availability to teach such coursework.
The New York State Office of Mental Health (NYSOMH) includes service users in the training of psychiatric hospital staff and found that service users reported feeling valued and empowered for having their opinions sought out and service providers (including social workers) felt higher respect for service user rights, greater acceptance of service user self-advocacy and greater sense of importance of viewing each service user as an individual Bassman (2000). Scheyett & Diehl [7] found that service users have a desire to participate in social work education through co-teaching, course content development and implementation, being included in curriculum committee and syllabus review processes as well as research and field practicum. Hence, the motivation is there for both students and service users to welcome service user inclusion in social work education.
Methodology
As of July 2014, there were 500 undergraduate and 233 graduate social work programs that are accredited by the CSWE. The CSWE provides an up-to-date list of all accredited undergraduate and graduate programs on their website, along with contact information for each program director. All 733 programs were emailed invitations to participate in the Survey Monkey questionnaire; follow up reminders were sent on a weekly basis.
This quantitative study is as an exploratory cross-sectional research study using non-probability purposive sampling techniques. The research tool is a non-pre-existing questionnaire, developed through a review of literature informing the theoretical framework, uploaded to Survey Monkey, thereafter, targeted toward social work faculty across the United States. Informed consent was attained through Survey Monkey before participants began the questionnaire. Data were collected from 12:00 AM EST March 1st, 2018 until 11:59 PM EST April 30th, 2018, a duration of 61 days.
The data collected were analyzed through SPSS using descriptive statistics to determine percentages and frequencies of responses to questions. Bivariate analyses were employed to determine relationships between two variables while multivariate analyses were employed to explain the variance among variables. Factor analysis was employed in efforts to estimate a model that explains variance and covariance between the observed variables by a set of underlying factors and weightings. Reliability was analyzed through Cronbach’s Alpha (otherwise known as coefficient alpha) and validity was analyzed through Pearson’s r. Factor analysis helps explore the actual, rather than mere theoretical, correlations between variables. This required trimming away some items to reduce error, increasing reliability and possibly forming new, unexpected factors. The Kaiser- Meyer-Olkin (KMO) Measure of Sampling Adequacy is a statistic that allows the researcher to look at some basic assumptions. KMO, varying from 0-1 with the industry standard being 0.50 or higher to proceed, generally indicates whether the variables can be grouped into a smaller set of underlying factors. KMO values below 0.50 suggest that factor analysis may not be useful. By employing factor analysis as the predominant analysis modality to uncover the underlying structure of this study’s set of variables, the researcher believes that the richness of collected data was drawn out and presented on full, clear display.
The questionnaire was piloted to several colleagues and professors of the researcher and suggested edits were considered and, in most cases, implemented. Despite having been piloted and thereafter refined, there were limitations and obstacles to this study. Only 404 social work faculty participated in the study during the 61-day data collection period. Although the questionnaire was purely quantitative, completing it, even with time and intention, may have posed challenges for social work faculty who are resistant to, or unable to access, online surveys. The same can be said for social work faculty who use different terminology than that of the questionnaire and those whose primary language may not be English. Finally, social work faculty, despite being assured confidentiality, may not always answer honestly because they know the discipline of social work favors service user inclusion in all aspects of the social work profession. Hence, social work faculty may have answered this survey as though they are in favor of service user inclusion in social work education even if they aren’t in favor of it, an anticipated threat to internal validity [10,11].
Quantitative research methods focus more on breadth than depth, this study is no different. While a great deal of content was collected through this study, it was lacking a great deal of context by design. Follow-up questions, leading to higher clarity, were not available. A personalized data collection experience was not provided to participants, rather a uniform process by which all participants were expected to respond.
Quantitative data aims to quantify and analyze collected data into numbers, frequencies and algorithms, furthering potential for a loss of context in the presentation of content. In contrast to qualitative research, quantitative designs assume a single, aggregate reality (objectivity) with little to no variation (subjectivity). Either design can be used to study any topic, and both are careful, diligent processes to discover and interpret knowledge. Although qualitative design would clearly yield more context and complexities, a quantitative design was chosen to reach a greater number of participant responses in the interest of external validity and generalizability as well as to limit researcher bias as much as possible [12].
Despite the detail within the informed consent, some participants may not have been willing to share how included or not included social service users are in their programs for fear of seeming to fall short of community outreach goals or deviating from program standards and bylaws. Although all efforts were made to bridge any potential gaps in communication and understanding, participants may still think that service users are included in their respective programs when they are not. Other participants may instead think that service users are not included in their programs when they are, based on what their own idea of what service user inclusion looks like. All of this means that substantial considerations must be made for a myriad of potential scenarios while reviewing survey results, while acknowledging that it would be impossible to prepare for every individual variation beforehand.
Results
The dependent variable
Scale reliability is generally a prerequisite to scale validity, thus the industry standard 0.70 minimum benchmark [10,11] in calculating Cronbach’s Alpha was employed to determine internal consistency/reliability among questions related to (DV) service user inclusion in social work education, an 11 item inventory aggregated into a single composite score. The Cronbach’s Alpha coefficient associated with the inventory was 0.891 (N = 370), justifying use of the composite score for DV.
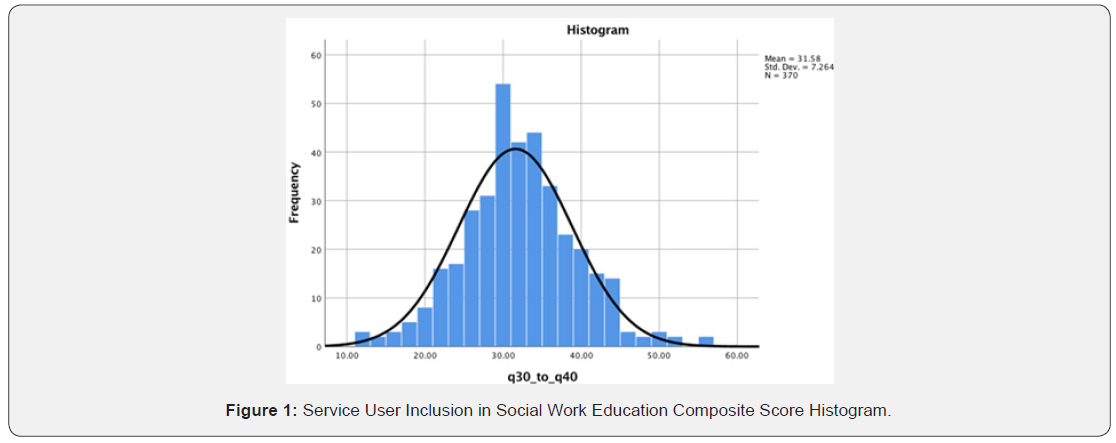
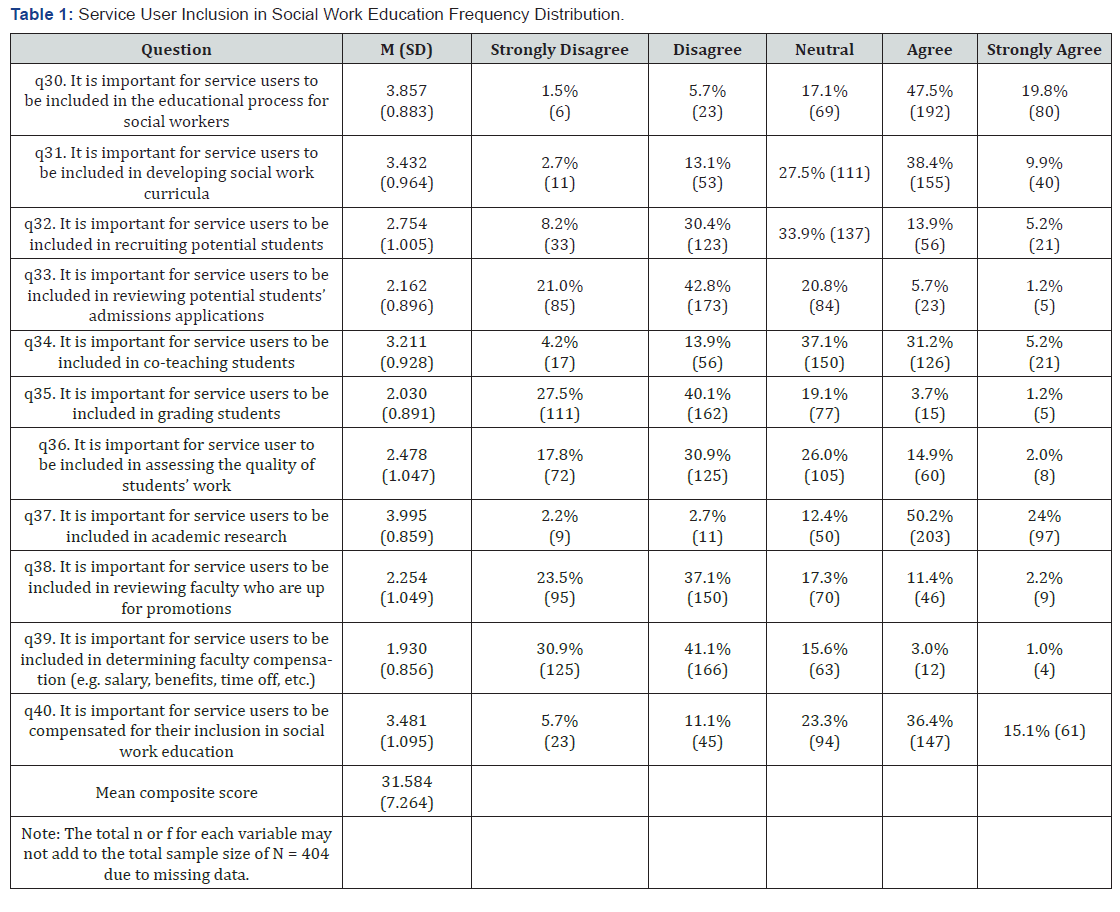
The theoretical range for the DV was 0-55 with higher scores indicating more positive attitudes toward service user inclusion in social work education. The mean composite score of the DV for participants in this study (N = 370) was 31.584 (SD = 7.264) with the median score being 31, and the mode being 29 (N = 31 or 8.378% of participants). The lowest recorded score among the participants was 12 and the highest was 55, setting the range at 43. A visual depiction of the range of participants’ scores mirrored a normal curve as indicated in (Figure 1) with elements of DV further detailed in (Table 1).
Composite bivariate analyses
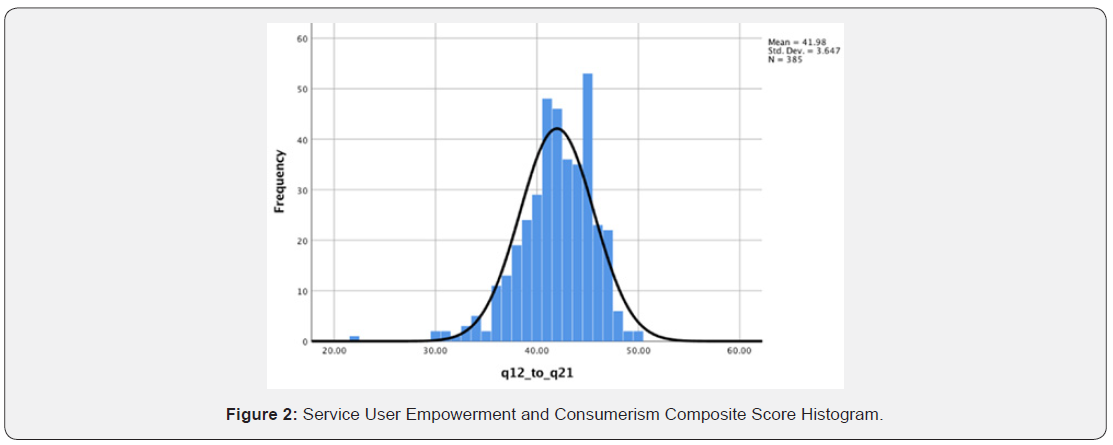
Cronbach’s Alpha was calculated to determine the internal consistency/reliability among questions related to (IV1) service user empowerment and consumerism, a 10-item inventory aggregated into a single composite score with a theoretical range from 0-50 with higher scores indicating more positive attitudes toward service user empowerment and consumerism. The Cronbach’s Alpha coefficient associated with the inventory was 0.565 (N = 385), below the industry standard 0.70 minimum benchmark. The mean composite score for IV1 was 41.977 (SD = 3.647), with the median score of 42 and the mode being 45 (N = 53 or 13.766% of participants). The lowest recorded score was 22 and the highest recorded score was 50, setting the range at 28. A visual depiction of the range of participants’ scores mirrored a normal curve as indicated in (Figure 2) with elements of IV1 further detailed in (Table 2).

Cronbach’s Alpha was calculated for inventory items associated with both IV1 (10 items) and DV (11 items) together to determine internal consistency/reliability among all 21 items. The Cronbach’s Alpha coefficient associated with the combined inventories was 0.813 (N = 370), thus confirming internal consistency/reliability among IV1 and DV. There was a weak, statistically significant, positive relationship, between IV1 and DV (r (370) = 0.152, p=0.003). Cronbach’s Alpha was calculated to determine the internal consistency/reliability among questions related to (IV2) service user inclusion in social work organizations, an 8-item inventory aggregated into a single composite score. The Cronbach’s Alpha coefficient associated with the inventory was 0.832 (N = 378), exceeding the industry standard 0.70 minimum benchmark.
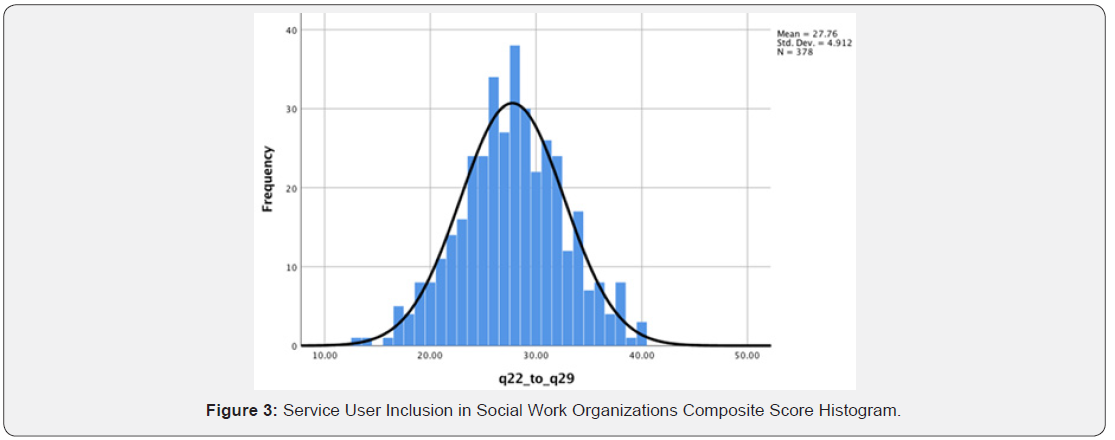
The mean composite score for IV2 was 27.762 (SD = 4.912), with the median score of 28 and the mode being 28 (N = 38 or 10.052% of participants). The lowest recorded score was 13 and the highest recorded score was 40, setting the range at 27. A visual depiction of the range of participants’ scores mirrored a normal curve as indicated in (Figure 3) with elements of IV2 further detailed in (Table 3).
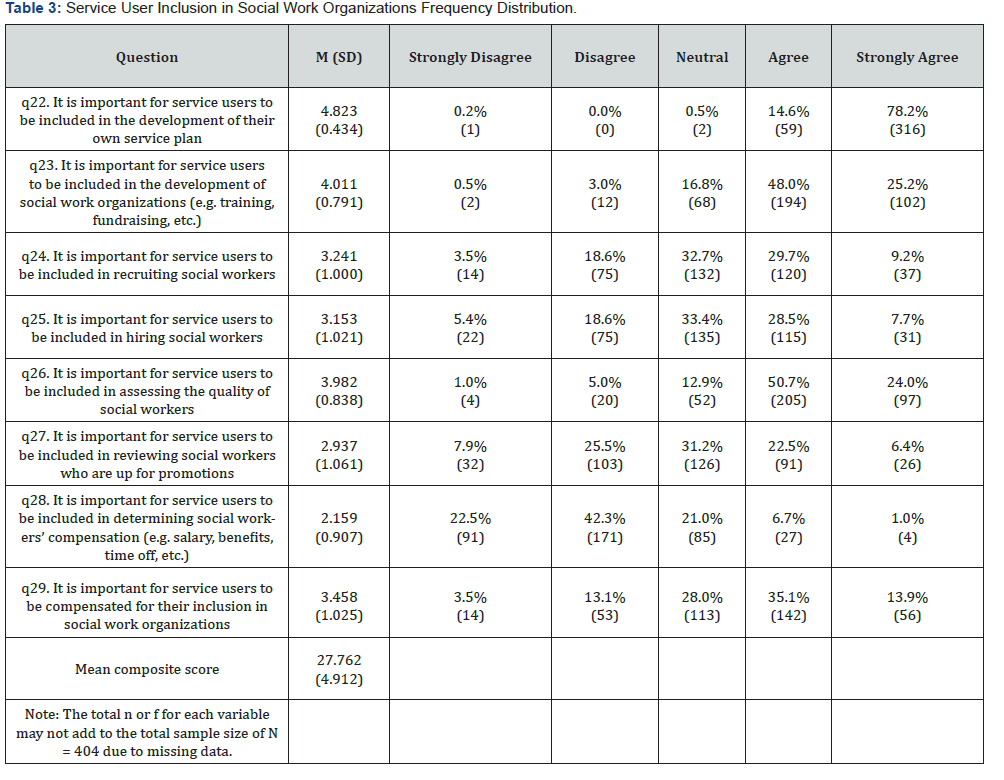
Cronbach’s Alpha was calculated for inventory items associated with both IV2 (8 items) and DV (11 items) together to determine internal consistency/reliability among all 19 items. The Cronbach’s Alpha coefficient associated with the combined inventories was 0.922 (N = 370), thus confirming internal consistency/reliability among IV2 and DV. There was a strong, statistically significant, positive relationship between IV2 and DV (r (370) = 0.765, p=0.000).
Factor analysis
Factor analysis was employed to both validate this instrument measuring attitudes toward service user inclusion in social work education and to explore factors predicting directionality of attitudes (positive versus negative attitudes toward service user inclusion in social work education). IV1 was not found to be internally consistent/reliable (Cronbach’s Alpha of 0.565, below the industry standard 0.70), only so in conjunction with DV (Cronbach’s Alpha of 0.813, meeting the
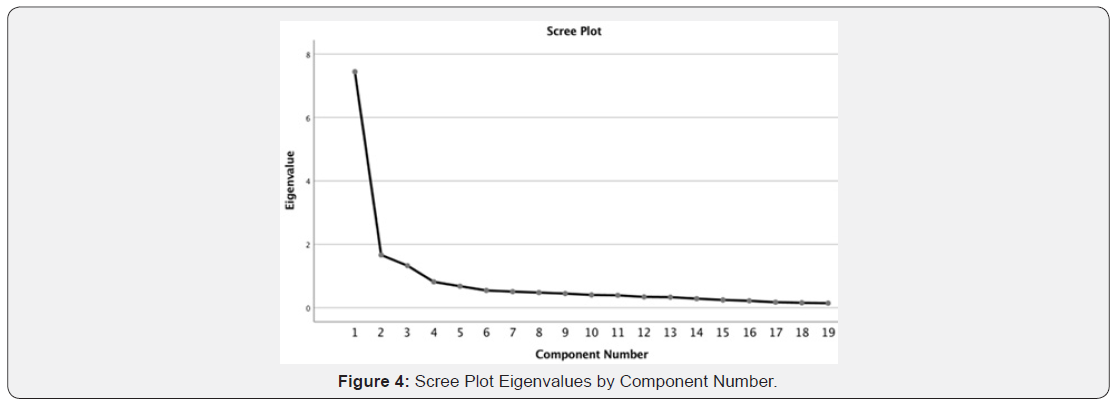
The internally consistent/reliable and statistically significant variables and correlations validating the relationship between IV2 and DV were analyzed through dimension reduction, specifically factor analysis – principle components. The Varimax rotation method was selected for extraction. With IV2 and DV not aggregated into composite scores representing each variable individually, three components were extracted through factor analysis – principle components, with a Scree Plot Eigenvalue of 1 or higher, as visually depicted in (Figure 4). The three components and the overall sums of squared loadings explain 62.909% of the total variance between IV2 and DV, as visually depicted in (Table 4).

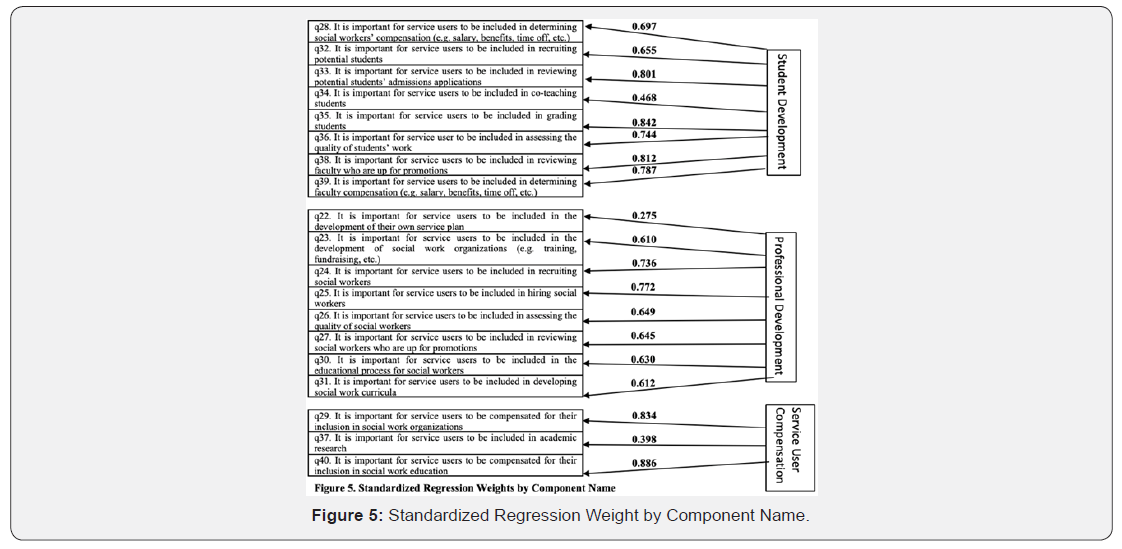
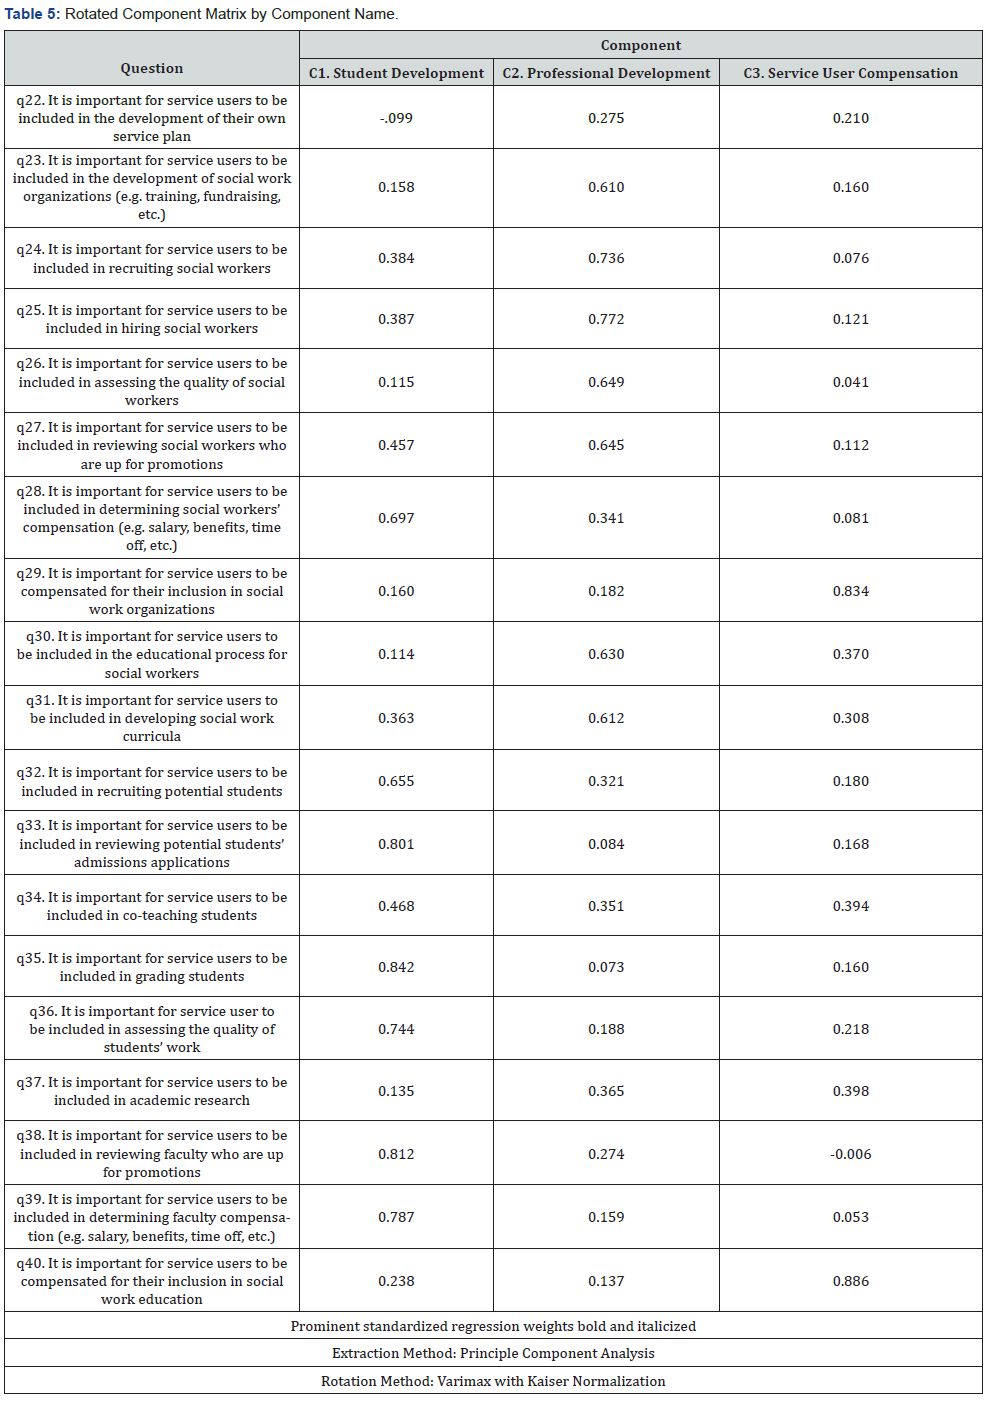
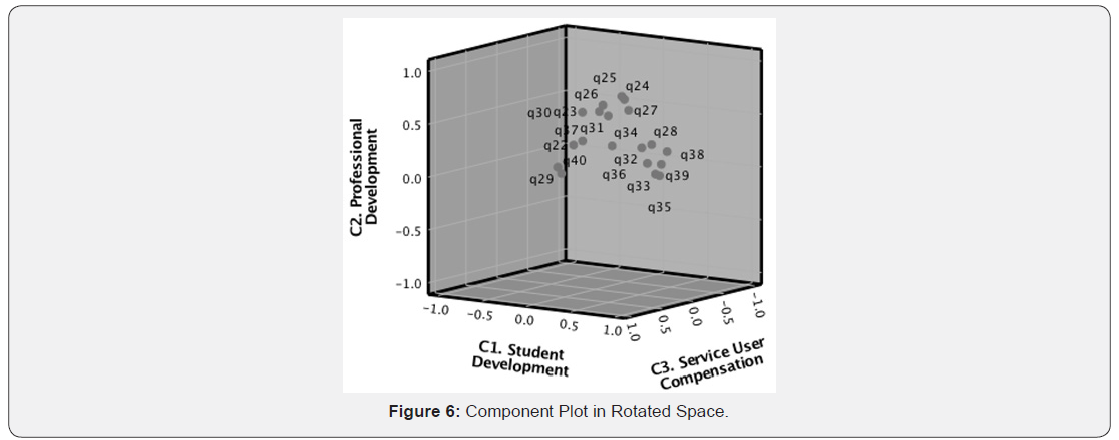
The Kaiser-Meyer-Olkin Measure of Sampling Adequacy for factor analysis was 0.910, with the industry standard being 0.5 or higher [10,11]. Analyzing the Bartlett’s Test of Sphericity shows a significance of 0.000, indicating statistical significance, suggesting that factor analysis was useful. Based on the Principle Component Analysis extraction method using the Varimax with Kaiser Normalization rotation method, the Rotated Component Matrix, (Table 5), gleans three extracted factors that were then examined for loading weights upon all elements of IV2 and DV. This analysis finds that Component 1 (C1) appears to pertain to student development, Component 2 (C2) appears to pertain to professional development and Component 3 (C3) appears to pertain to service user compensation, with standardized regression weights visually depicted by (Figure 5).
The component plot in rotated space (Figure 6) gives a visual depiction of where each element of IV2 and DV fall within a threedimensions (C1, C2 and C3) space. These three components were then saved as variables for the purpose of analysis through linear regression for to establish model fit.
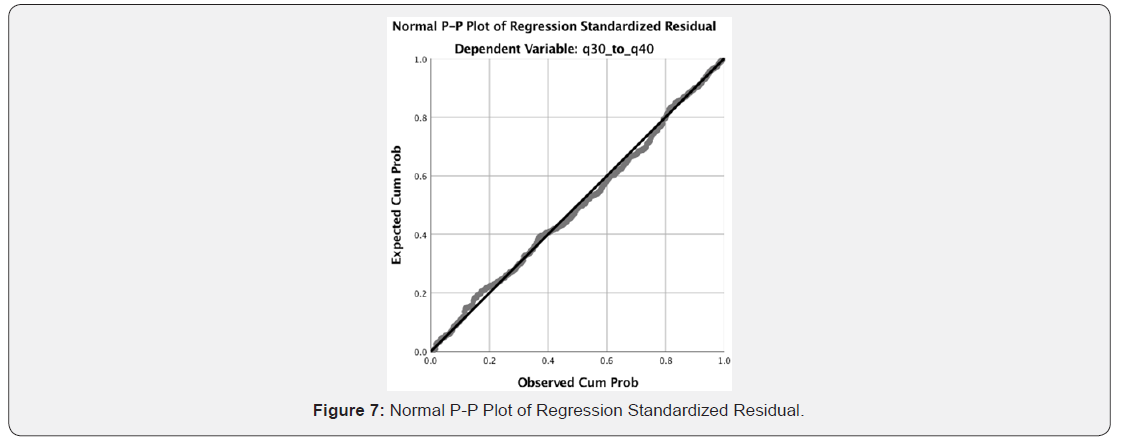
Linear regression shows that all three components are statistically significant in determining DV, each with a significance of 0.000. C1, student development, is most important for determining DV as it has an unstandardized beta of 5.690 and a standardized beta of 0.783. C2, professional development (unstandardized beta of 3.016 and standardized beta of 0.415) and C3, service user compensation (unstandardized beta of 3.040 and standardized beta of 0.419) are of some importance in determining DV (Table 6). The model summary shows values of 0.961 for R square as well as adjusted R square (Table 7) while the normal P-P plot of regression standardized residual gives a visual depiction of the, establishing model fit (Figure 7).


Discussion
Composite bivariate analyses showing results that are statistically significant were both attitudes on service user empowerment and consumerism (IV1) and attitudes on service user inclusion in social work organizations (IV2), found to show statistically significant correlation with attitudes on service user inclusion in social work education (DV). IV1 shows a weak, positive, but significant correlation of 0.152 with a two-tailed significance of 0.030. Thus, those who favor service user empowerment and consumerism are likely to favor some service user inclusion in social work education. IV2 shows a strong, positive, significant correlation of 0.765 with a two-tailed significance of 0.000. Thus, those who favor service user empowerment and consumerism are likely to favor more service user inclusion in social work education.
Since IV2 was found to be both independently internally consistent/reliable and show statistically significant correlation with DV, the relationship amongst the two was analyzed through factor analysis. The data associated with Scree Plot Eigenvalues, the Keyser-Meyer-Olkin Measure of Sampling Adequacy and the Bartlett’s Test of Sphericity essentially show that when IV2 and DV were not aggregated into composite scores representing each variable individually, three components were extracted through factor analysis explaining 62.909% of the total variance.
Essentially, when studying IV2 and DV, we are studying 62.909% of the same concepts, components or factors. In Layman’s terms, when studying sampled social work faculty and their attitudes on service user inclusion in social work organizations (IV2) with their attitudes on service user inclusion in social work education (DV), we are studying similar concepts, components or factors. Delving further into the identities of these three components by cross-referencing them with individual elements of IV2 and DV shows that student development (C1), professional development (C2) and service user compensation (C3) were most important in determining attitudes on service user inclusion in social work education (DV). Linear regression created a model that shows C1, student development, is the most important of these factors. Based on these figures and narratives, these findings were both reliable and valid.
Implications and contributions to social work
The focus of this study pertains to collegiate social work curricula across the United States lacking service user inclusion at the academic level, despite the trademark of the profession being service user oriented. There may be some universities around the United States that promote an abbreviated simulation of UK mandates, but nothing on a national or regional scale is known to exist at this time. This research study is important and timely for several reasons: the extent of service user inclusion in US social work education remains relatively unknown and the findings from this study could further the knowledge in this area by identifying the attitudes of social work faculty.
Implications gleaned from this study pertaining to social work practice suggests that practitioners should be aware of how they have been taught to view service users and the underlying policies that may make service users believe they are more involved in their own service plan than they really are. Implications gleaned from this study pertaining to social work education suggests that students and faculty should be more self-aware of how they view service user inclusion. The CSWE (Council on Social Work Education) may find it fruitful to reinforce the core social work values in encouraging (and when appropriate, requiring) service user inclusion in social work education, just as the accrediting body does in the UK.
Social work is defined as “a practice-based profession and an academic discipline that promotes social change and development, social cohesion and the empowerment and liberation of people. Principles of social justice, human rights, collective responsibility and respect for diversities are central to social work. […] social work engages people and structures to address life challenges and enhance wellbeing” [13]. As the definition highlights, social work aims to engage people to enhance wellbeing and values collective responsibility in achieving this aim. The empowerment of individuals, groups and communities in need requires their active inclusion in the social work process of assessment, intervention and evaluation of services, yet service users’ views and perspectives are often ignored during this process [8,14]. This study’s findings indicate that much work remains in achieving buy-in from social work faculty across the US to embrace service user inclusion in social work education. Opening the door and allowing service users a seat at the table with decorated scholars is still not as accepted a practice or pursuit as the tenets of the social work profession suggest it should be.
considerations
There is a great deal of information to be gleaned from those with experiential knowledge on subject matter, beyond the limits of academic knowledge. The inclusion of service users in social work academia could help bridge the gap between academic knowledge and experiential knowledge. More importantly, meaningful inclusion of service users, defined as citizen power as opposed to tokenism or non-participation [15] is key in maintaining an environment where there is buy-in from all parties to advance social work theory and eventual practice.
However, cautiousness must be employed in aiming for meaningful inclusion of service users, as there is a risk of retraumatization through continual recollection. Service users should not be taken advantage of and coercion must be kept in check to ensure that service user inclusion always remains voluntary. Not all service users may have an interest in advancing social work academia and that should be acknowledged by all.
Limitations
A major limitation to this study is the exclusion of service users in a study designed to highlight the importance of service user inclusion. The primary reason behind this decision was to first establish the attitudes of social work faculty across the United States. This is not designed to be an exhaustive and complete study on the topic, further research must be done including service users, students and other constituents.
The research tool employed in this study was a quantitative questionnaire, and as with any quantitative questionnaire, the aim here was breadth at the expense of depth. Nuance was non-existent with the use of this structured questionnaire. Furthermore, the questionnaire was author-constructed with the pre-existing knowledge of a potential for high social desirability of participant responses (participants may have answered in such a way as to appear as though they value service user inclusion more than they do). Since “neutral” was a choice in the majority of questions, it’s likely that greater variation (and statistical significance) could have been established if “neutral” was not an available choice within the questionnaire. As with any newly constructed questionnaire, hindsight highlights a plethora of variables that could have been included but were not. For this study, a couple of these variables were years since social work practice and personal experience as service user, among many other potentials. Purposive sampling, employed in this study, is a non-probability sampling method, yielding results that are not as generalizable as probability sampling methods [10,11].
Areas of future research
This researcher’s goal has been to learn about the attitudes of faculty within social work programs toward service user inclusion in social work education, thereafter, mapping out the mechanisms by which such inclusion could potentially be achieved. The information gathered could eventually lead to the development of a “best practice” model, which could be implemented and evaluated on an ongoing basis. Future funding could enable programs to implement this “best practice” model and evaluate the outcomes for service users and students, thus fulfilling the need for evidence on the effectiveness of service user inclusion in social work education [4]. This study, by no means exhaustive and complete, aims to move one step closer to this “best practice” model by being a point of reference for future studies of similar nature.
With a priori hypotheses now established through this study in the way of three components (student development (C1), professional development (C2) and service user compensation (C3)), the next step from this study could be to run a Confirmatory Factor Analysis (CFA) using a new sample set to test for and confirm these findings. Further next steps could include approaching this topic from a qualitative perspective. Including variables assessing faculty’s personal experience as a service user and/or carer as well as years since last direct practice with service users/careers would further advance this topic.
This study only includes social work faculty across the United States. Next steps from this study, whether qualitative or quantitative, could further expand the sample to include students, service users and/or careers. It would be helpful to find what these groups would see as helpful in-service user inclusion moving forward, in addition to what they view as barriers and facilitators to inclusion. Service users of social work services have formed advocacy groups to fight for inclusion in the shaping of social services and have used the slogan “nothing about us without us” in their mission. Service users argue for inclusion in all aspects of social work services from the education of future social workers to the evaluation of services and consultation on policies [8,14,16,17]. This exploratory study only examines how social work educators perceive service user inclusion in the academic process. Further research is needed through exploratory, descriptive and explanatory study designs bridge the gap between this study’s findings and the expressed spirit of the social work profession.
The extent of service user inclusion in US social work education remains relatively unknown. The findings from this study could further the knowledge in this arena by having identified the attitudes of service user inclusion from the perspective of sampled social work faculty across the United States. The data gathered, analyzed and (soon-to-be) disseminated (through social work conferences and peer-reviewed journals) could potentially lead to the development of a “best practice” model of service user inclusion in social work education. This model could then be implemented and evaluated on an ongoing basis with both undergraduate and graduate social work programs, thus fulfilling the need for evidence of the effectiveness of service user inclusion in social work education [4].
https://juniperpublishers.com/asm/ASM.MS.ID.555632.php
For More Articles in Annals of Social Sciences & Management studies Please Click on: https://juniperpublishers.com/asm/index.php
For More Open Access Journals In Juniper Publishers Please click on: https://juniperpublishers.com/index.php
For more queries Juniper publishers please click on: https://www.quora.com/Is-Juniper-Publisher-a-good-journal-to-publish-my-paper


Comments
Post a Comment